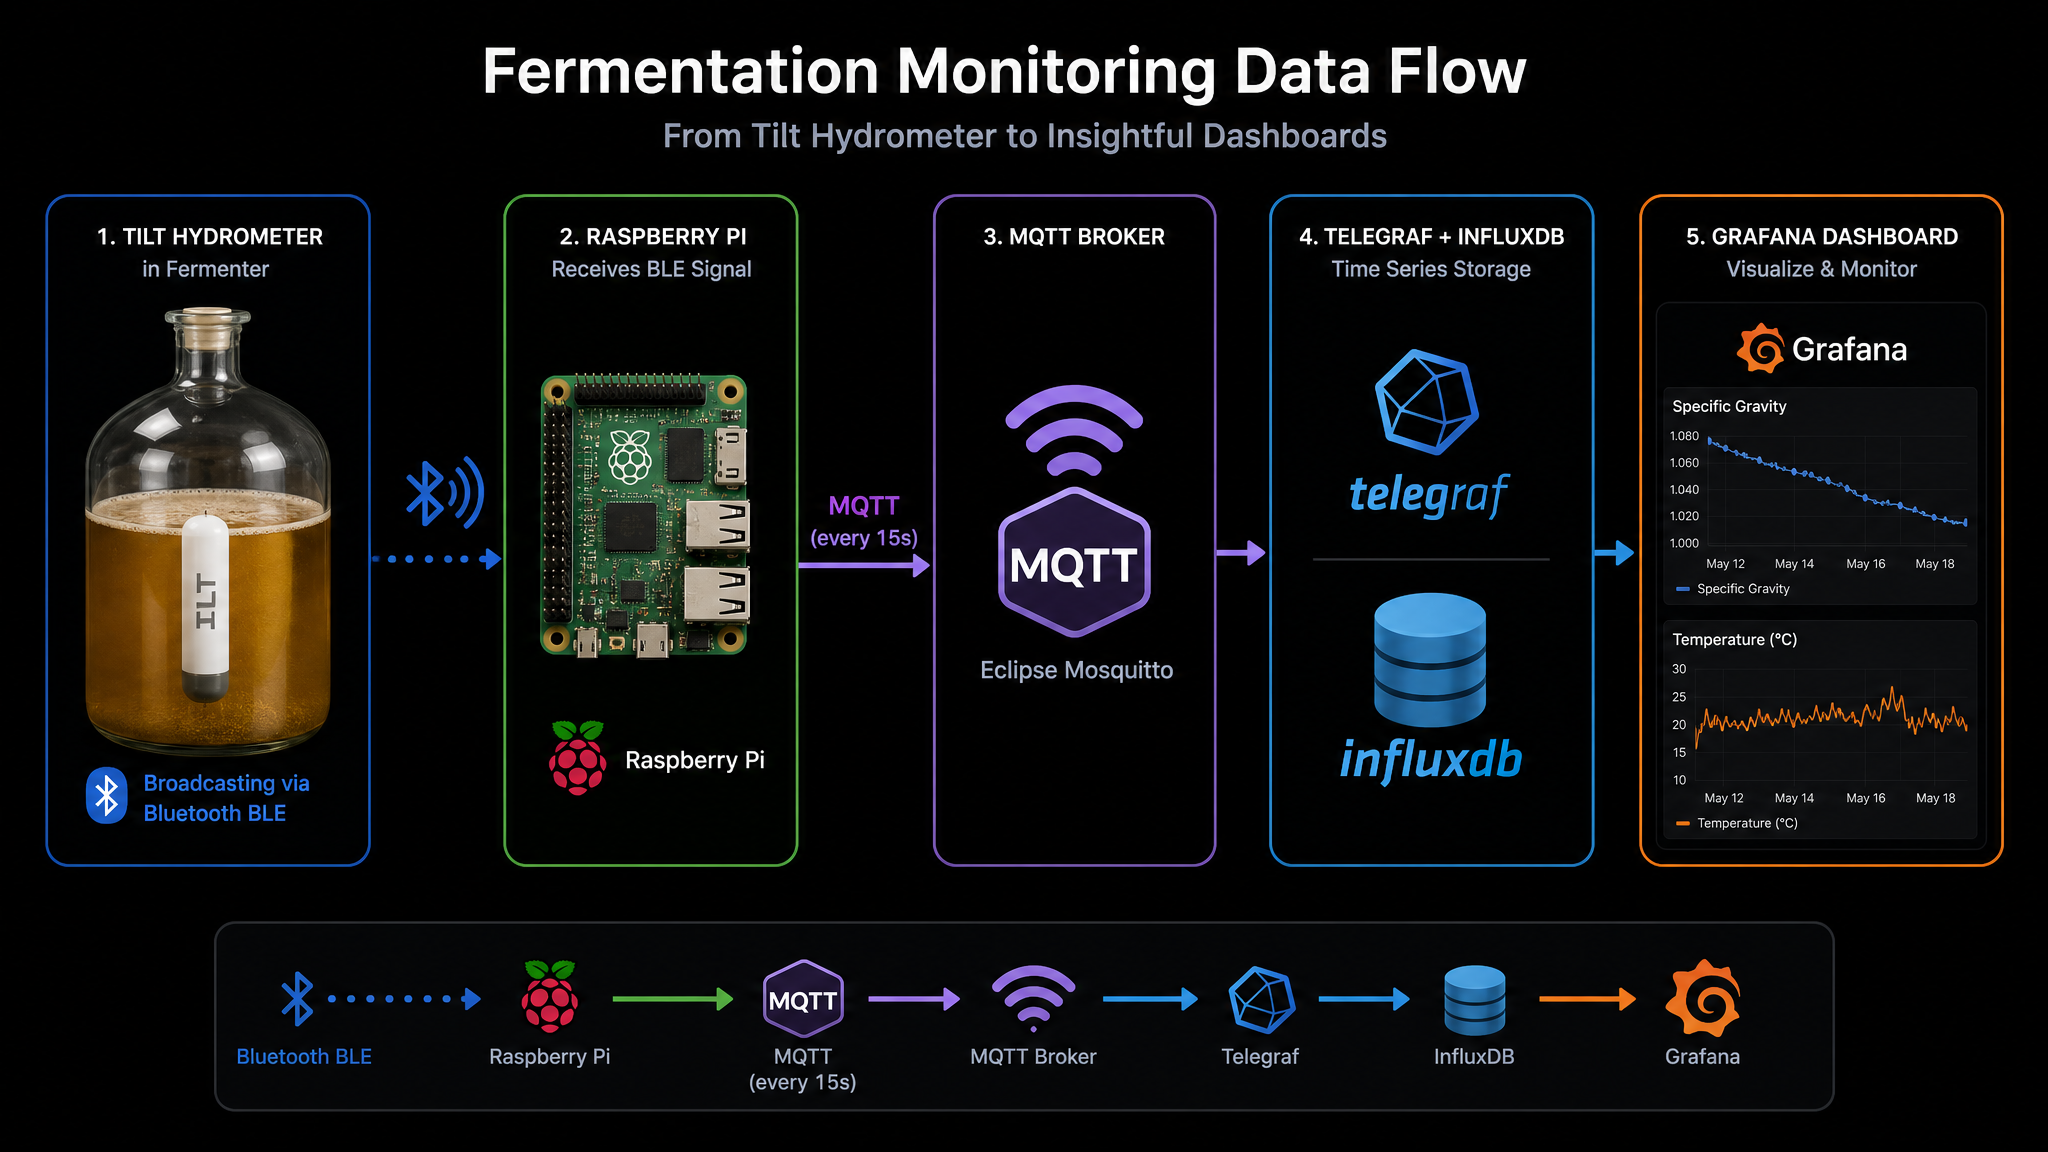
Systemarchitektur-Diagramm
infografik mit ki erstellendatenfluss mit ki visualisierensystemarchitektur-diagramm kidatenvisualisierung mit ki animieren
Prompt
A clean system architecture diagram showing a fermentation monitoring data flow. At the left, a Tilt Hydrometer floating in a glass fermenter, broadcasting via Bluetooth BLE signal. Next, a Raspberry Pi receiving the BLE signal. An arrow labeled 'MQTT (every 15s)' leads to an MQTT broker icon. Then an arrow to Telegraf + InfluxDB (database icon), then an arrow to a Grafana dashboard showing charts of Specific Gravity and Temperature over time. Modern dark theme, clean lines, labeled boxes and arrows, infographic style.
Mehr davon