Costa Rica Climate Infographic
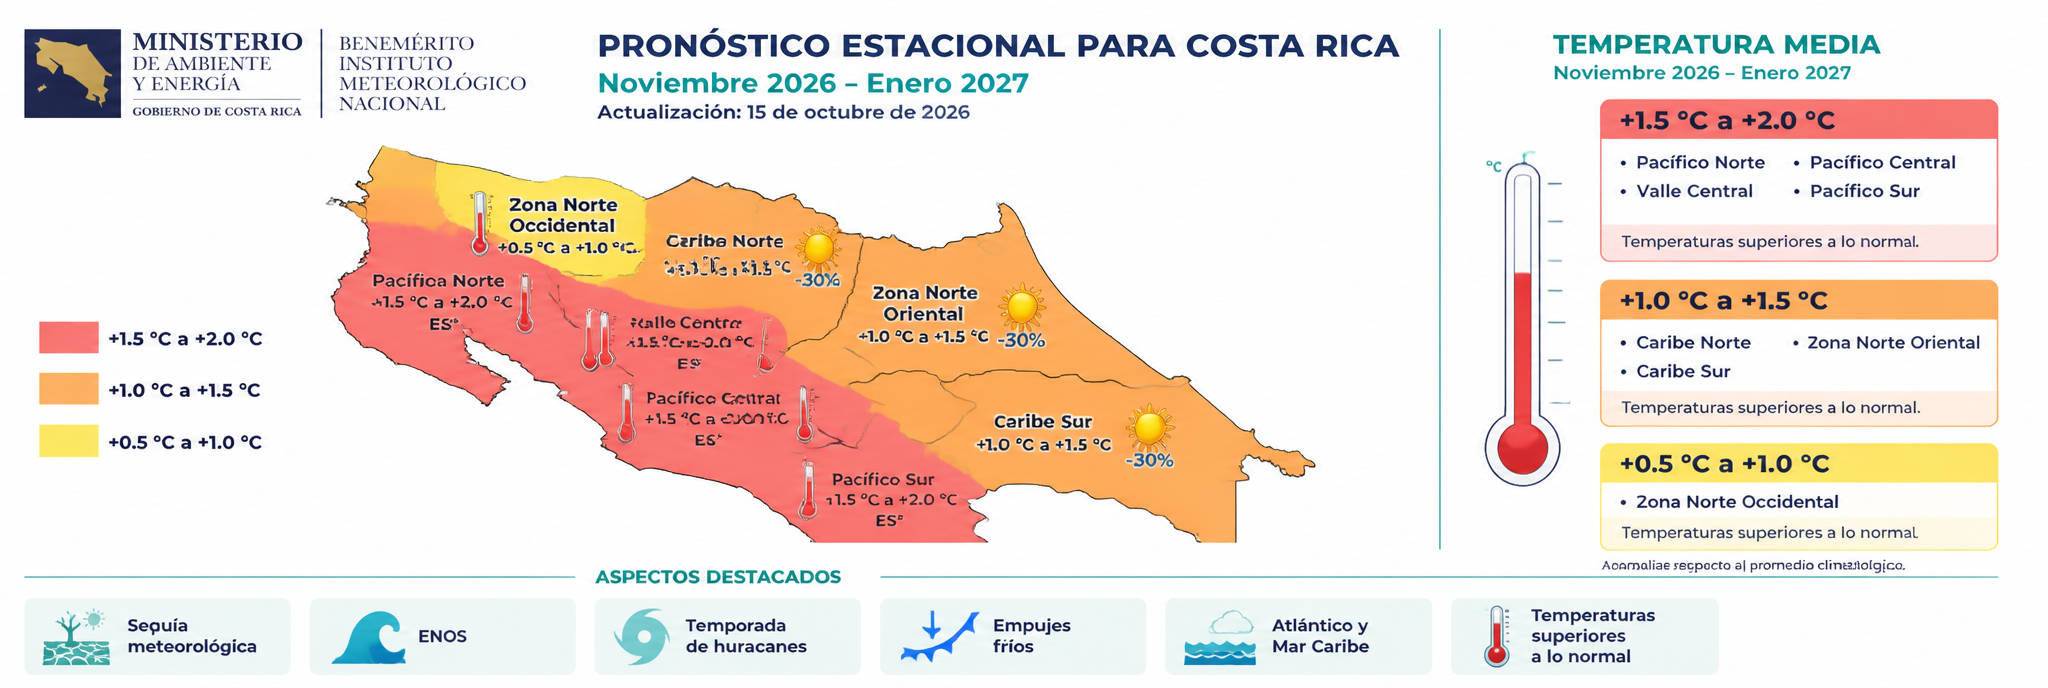

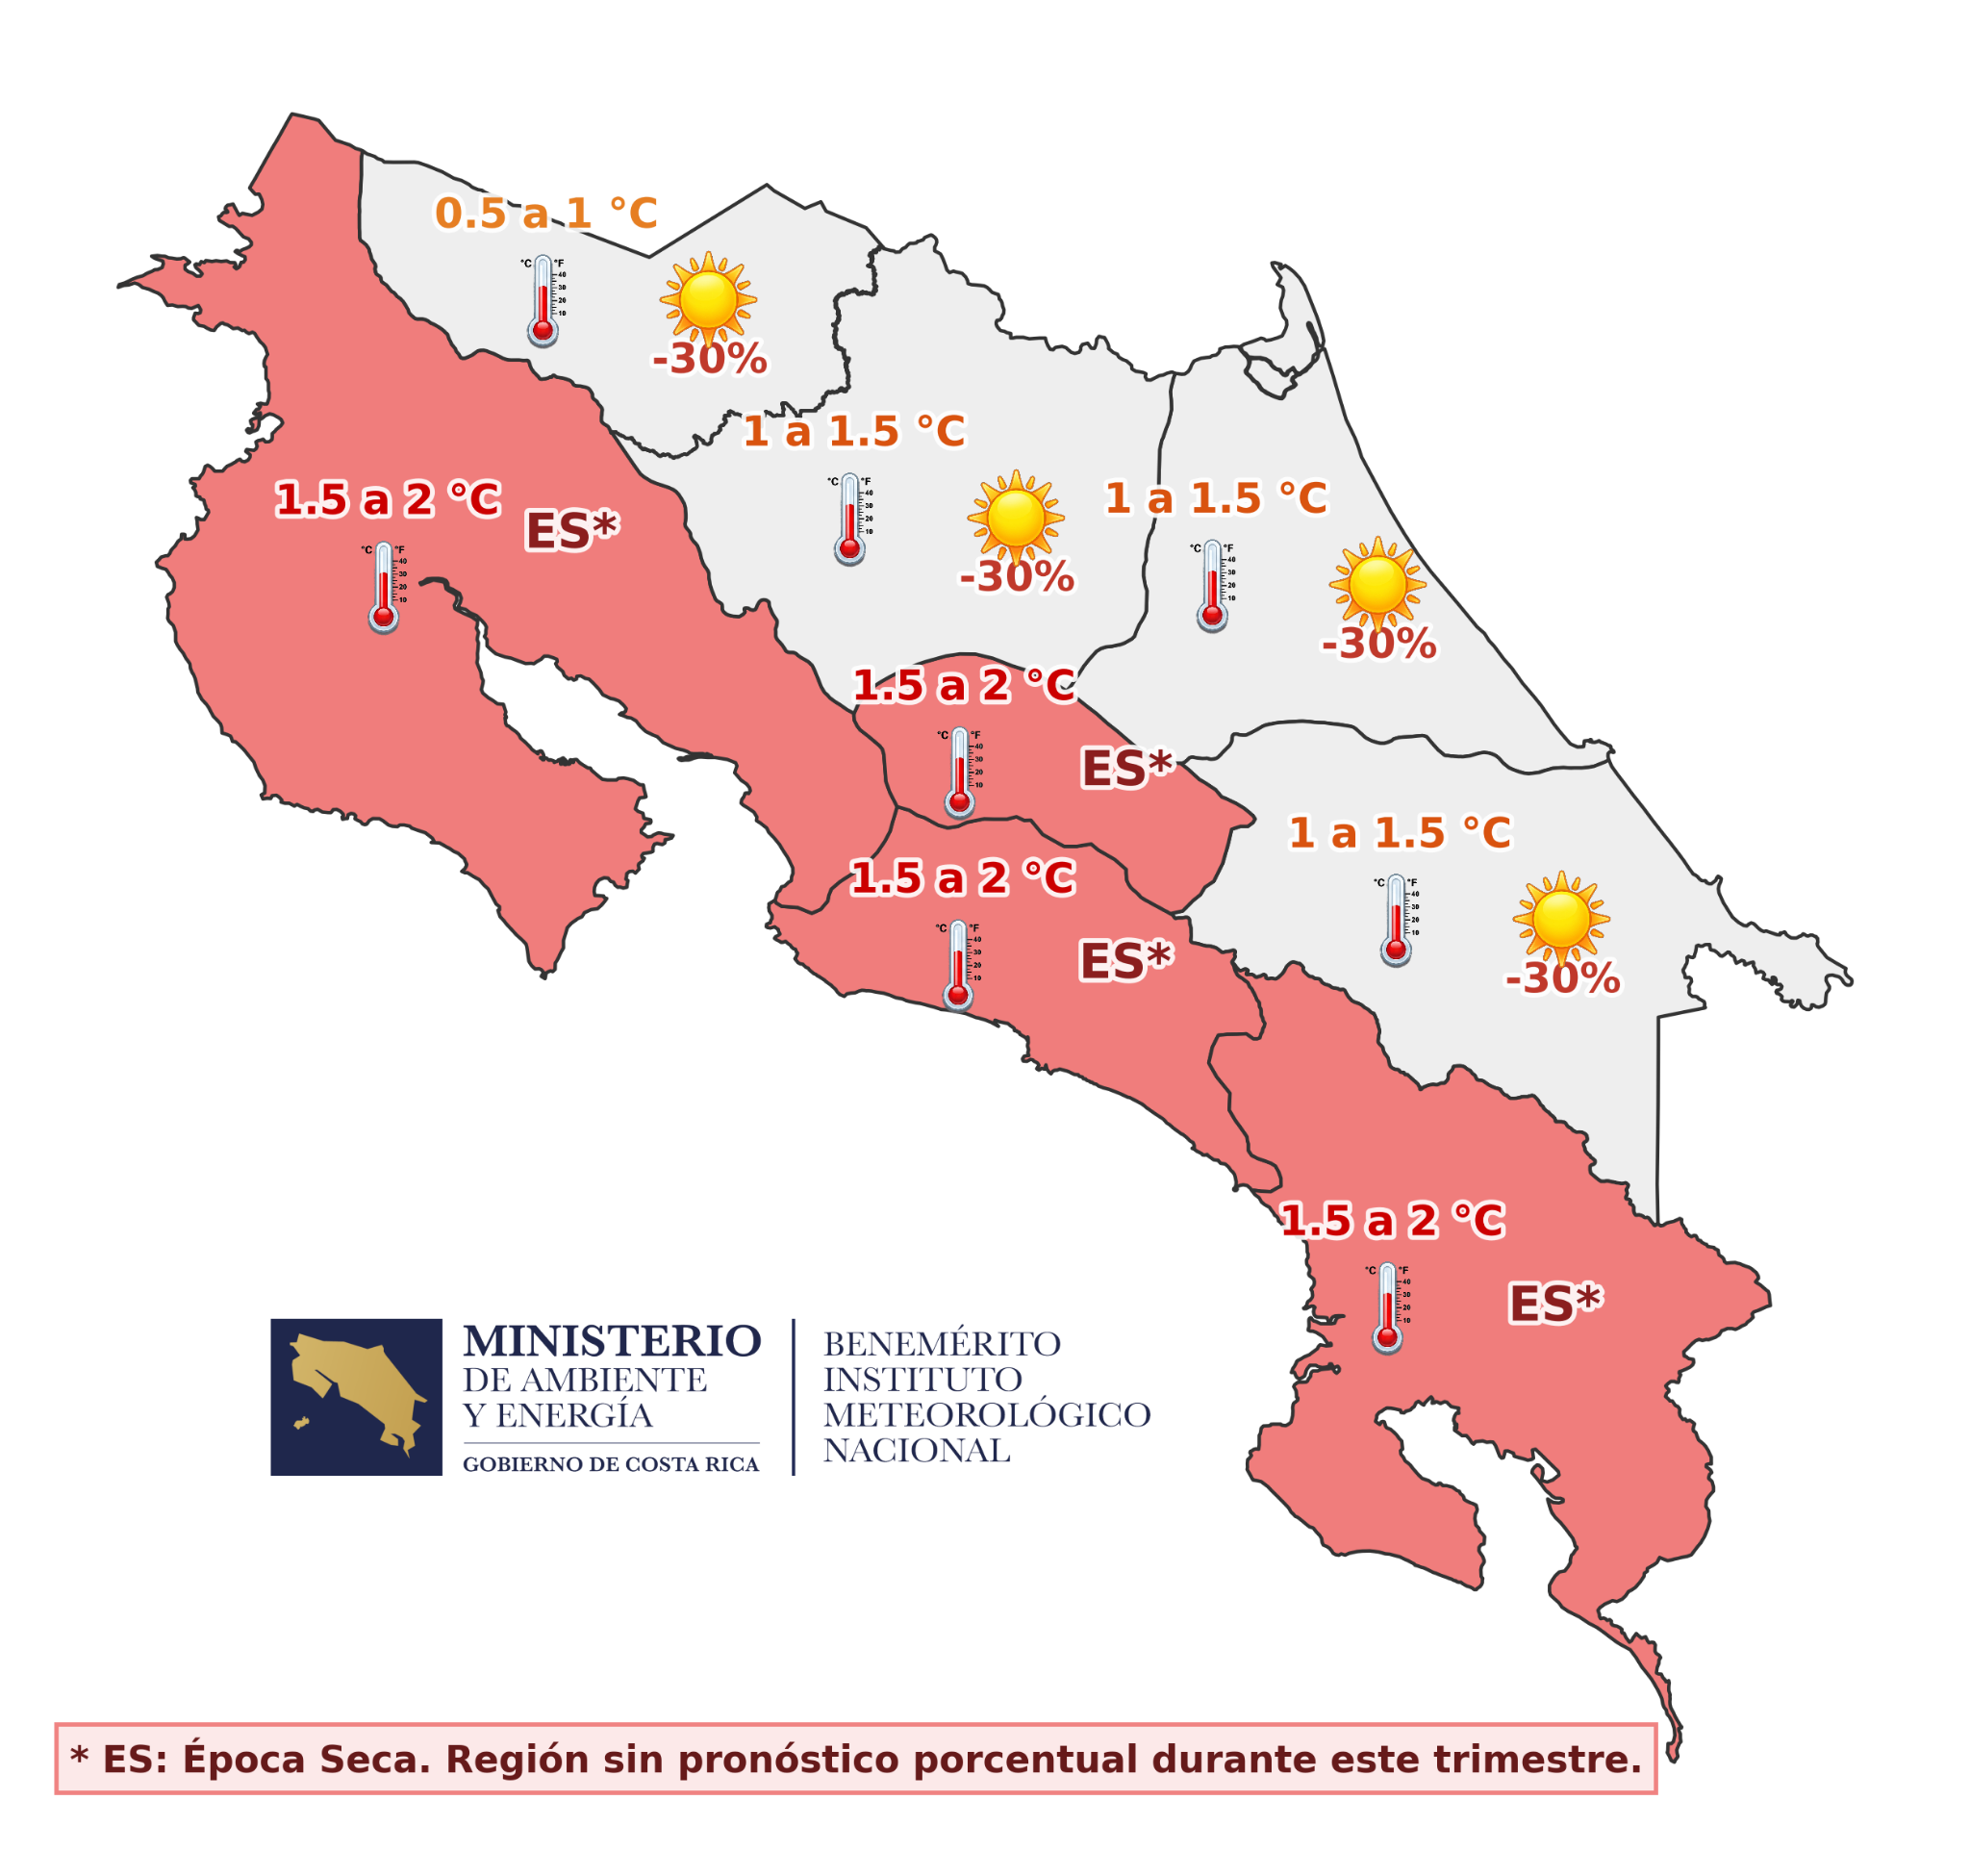
Create a horizontal A4 landscape infographic with white background, clean modern governmental design style, using IMN and MINAE institutional colors (teal, green, blue). Layout: two columns — left 75%, right 25%. HEADER: Official MINAE-IMN logo (Image 2) at top left. Title: "PRONÓSTICO ESTACIONAL PARA COSTA RICA". Subtitle: "Noviembre 2026 – Enero 2027". Secondary text: "Actualización: 15 de octubre de 2026". No slogans, no 'Ciencia para la Vida', no social media icons. LEFT COLUMN (75%): Use the weather map (Image 1) showing complete Costa Rica. Rainfall scenario with ~30% deficit labeled for Caribe Norte, Caribe Sur, Zona Norte Oriental. Temperature scenario: Red zone (+1.5°C to +2.0°C) for Pacífico Norte, Valle Central, Pacífico Central, Pacífico Sur. Orange zone (+1.0°C to +1.5°C) for Caribe Norte, Caribe Sur, Zona Norte Oriental. Yellow zone (+0.5°C to +1.0°C) for Zona Norte Occidental. Keep ES* labels visible. RIGHT COLUMN (25%): Title "TEMPERATURA MEDIA" "Noviembre 2026 – Enero 2027". Vertical thermometer in institutional style. Three colored boxes below: Red box "+1.5 °C a +2.0 °C" listing Pacífico Norte, Valle Central, Pacífico Central, Pacífico Sur — "Temperaturas superiores a lo normal." Orange box "+1.0 °C a +1.5 °C" listing Caribe Norte, Caribe Sur, Zona Norte Oriental — "Temperaturas superiores a lo normal." Yellow box "+0.5 °C a +1.0 °C" listing Zona Norte Occidental — "Temperaturas superiores a lo normal." Note: "Anomalías respecto al promedio climatológico." BOTTOM SECTION: Title "ASPECTOS DESTACADOS". Six equal cards: 1) cracked soil icon + "Sequía meteorológica", 2) ocean waves icon + "ENOS", 3) tropical cyclone icon + "Temporada de huracanes", 4) cold front icon + "Empujes fríos", 5) Caribbean Sea icon + "Atlántico y Mar Caribe", 6) thermometer icon + "Temperaturas superiores a lo normal." Do not include Instagram, Facebook, X, YouTube, 'Ciencia para la Vida', slogans, additional logos, dry season map, key dates, tables, redundant charts, Isla del Coco, or duplicate information.
More like this